Chitina Personal Use Salmon Fishery
Harvest & Effort
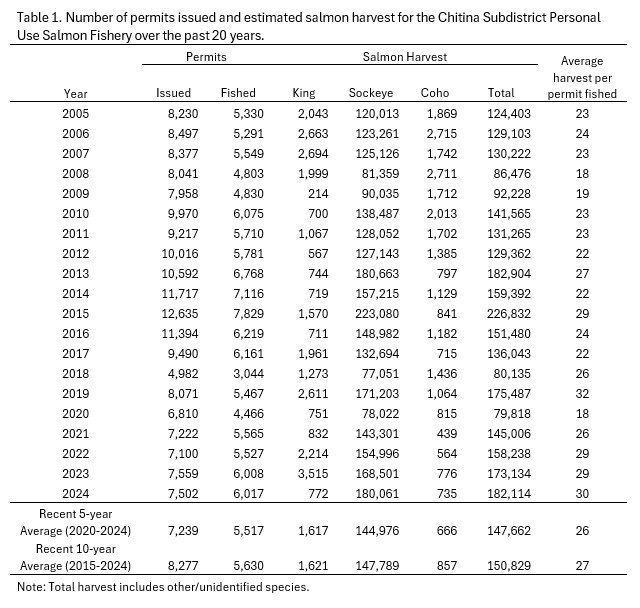
Over the last 20 years the Department has issued 4,982 - 12,635 permits annually for the Chitina Subdistrict Personal Use Fishery (see table below). The number of permits issued in this fishery dropped when a $15.00 fee was added in 2017, but the number of permits fished has remained steady.
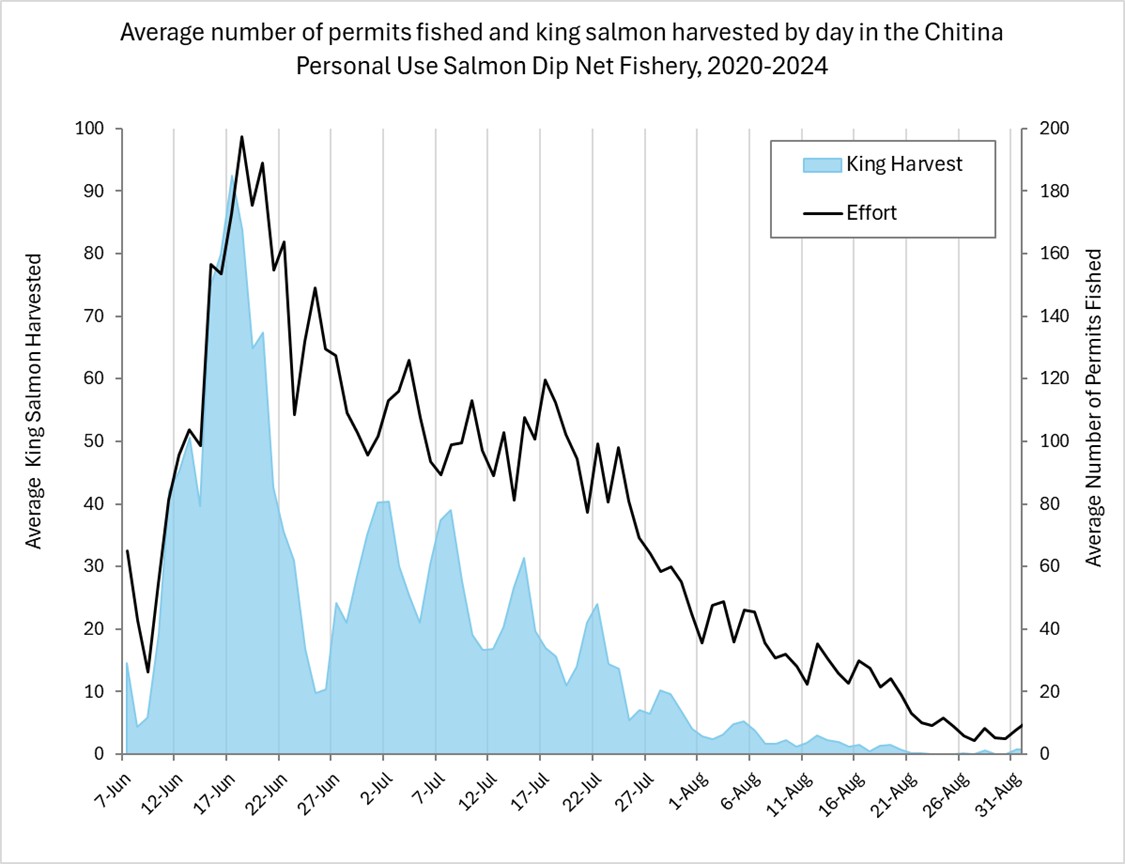
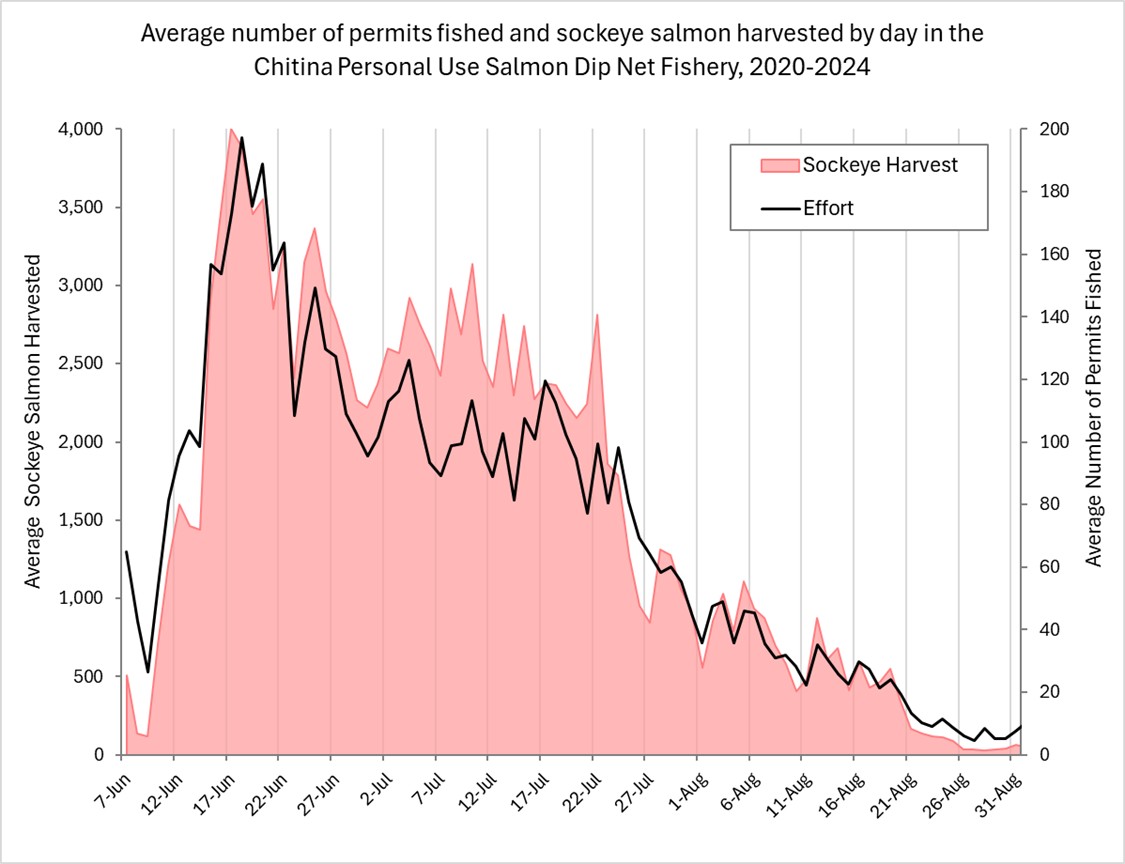
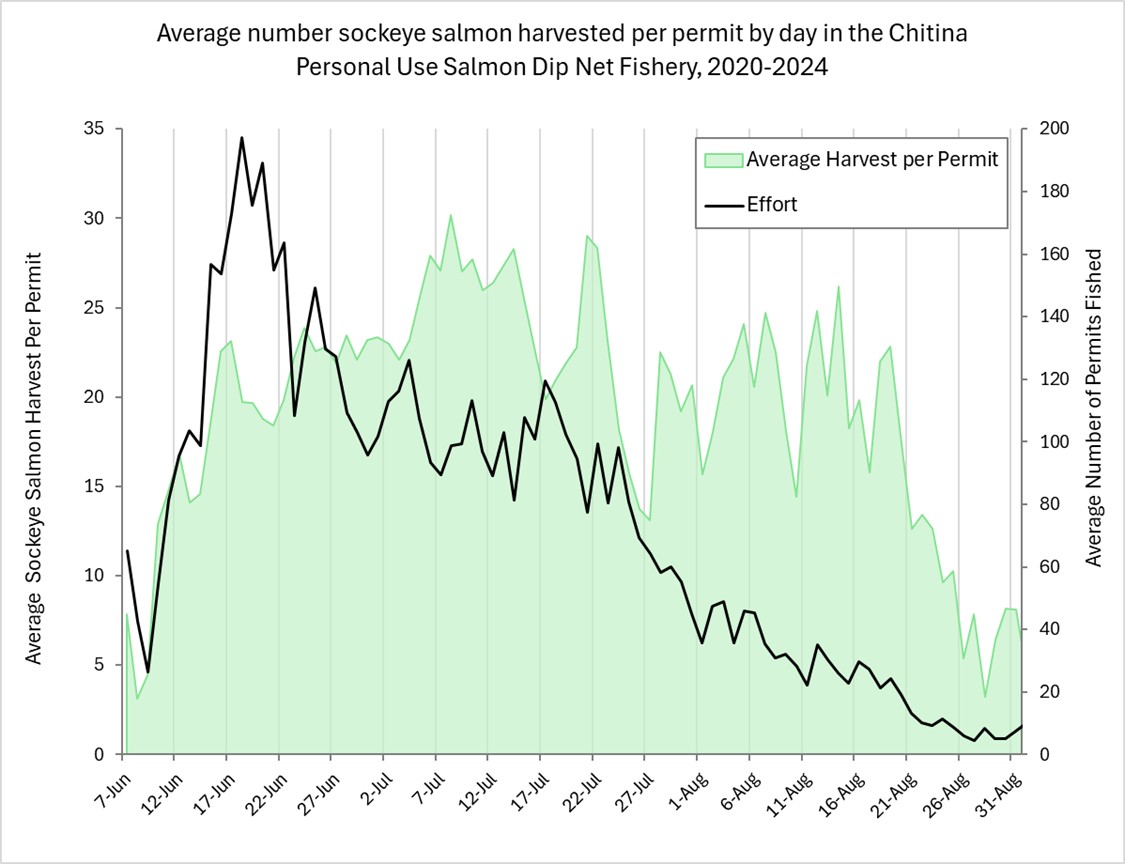
Generally, more people fish in the beginning of the season when king salmon are present in the fishery (see figures below). Harvest of king salmon is highest early in the season and corresponds with the fishing effort. While king salmon may be present all season, the bulk of the king salmon run is over by mid-July. The wild sockeye salmon run is usually highest in June and then drops off through the season. In late July and early August hatchery fish, bound for the Prince William Sound Aquaculture hatchery on the Gulkana River, provide a boost of salmon into the fishery and account for an average of about 16% of the overall harvest and as much as 75% of the harvest in a given week. Although total sockeye harvest is usually highest in June, corresponding with the highest effort, the average number of sockeye caught per permit is typically highest in July.
Harvest in the fishery is most affected by the number of fish running upriver, followed by the number of permits being fished, and finally by water level. Harvest is generally lowest during high water events but can also be low during very low water with a lack of adequate dipping sites. The most productive fishing can be immediately after a high water event, when the fish that have held in the river finally start moving.
Permit holders dip from shore or dip from boats. Generally, fishing from a boat is more productive since dipnetters can compensate for fluctuating water levels by moving to different locations. However, there are highly productive shore fishing sites accessible from the road right-of-way or by drop off from a boat.
Table. Number of permits issued and estimated salmon harvest for the Chitina Subdistrict Personal Use Salmon Fishery over the past 20 years.
When to fish
Watching the sonar counts at Miles Lake can provide an indication of the number of fish moving toward Chitina. It takes 2 - 3 weeks for fish to travel from the sonar site to the Chitina Subdistrict. The sonar counts published are all salmon and the counts are comprised of 95% sockeye salmon. Remember though, just because the sonar says lots of fish should be arriving in Chitina, the fishing may still be bad. Success can range from epic to terrible with changes in water level that are unpredictable and can occur anytime during the season.
Remember that from the beginning of the season through August 31, the fishery is only open as announced by Emergency Order. Before heading to Chitina, call the Department's 24-hour recorded hotline (907-822-5224) to make sure that fishing is open. The fishery is open 24-hours a day for the entire month of September in accordance with regulation.


